AI-driven Warehouse Optimization With 3D Digital Twin Technology

Empower your warehouse with 3D digital twin and AI-driven optimizations for dynamic slotting, streamlined pick paths, reduced costs and making data-backed decisions in real-time.

AI Warehouse with FREJA

FREJA is an AI-powered warehouse optimization solution that integrates seamlessly with your existing Warehouse Management System (WMS) or ERP.

Seamless WMS Integration – Connect via standard APIs, no system replacement needed.

Up to 40% Efficiency Gains – Reduce labor, energy use, and travel distances for fast ROI.

Dynamic AI Optimization – Automated slotting, pick path planning, and replenishment.

3D Digital Twin Visualizations – Simulate layouts, workflows, and efficiency improvements before physical changes.
FREJA delivers measurable savings, smarter decisions, and real-time visibility — making warehouses faster, leaner, and more competitive.

AI Warehouse with FREJA

FREJA is an AI-powered warehouse optimization solution that integrates seamlessly with your existing Warehouse Management System (WMS) or ERP.
faq-image

Latest Insights

Preatoni stands at the forefront of global real estate development, delivering iconic projects that redefine innovation and elegance. Stay updated with our latest news, project launches.

October 30, 2025
blog-1

Maximizing the Returns on Your Warehouse Automation

Is your warehouse struggling with shaky logistics, low efficiency, and poor OTIF (On-Time-In-Full) performance? Are you feeling the pressure to automate before the next peak season hits? Automation can be a game-changer — but only if you prepare properly. What worked for your neighbor’s warehouse won’t automatically work for yours. Success in automation starts long before the first robot hits the floor. Here’s how to think and prepare for the journey. 1. Clean Up Your Current Processes First 
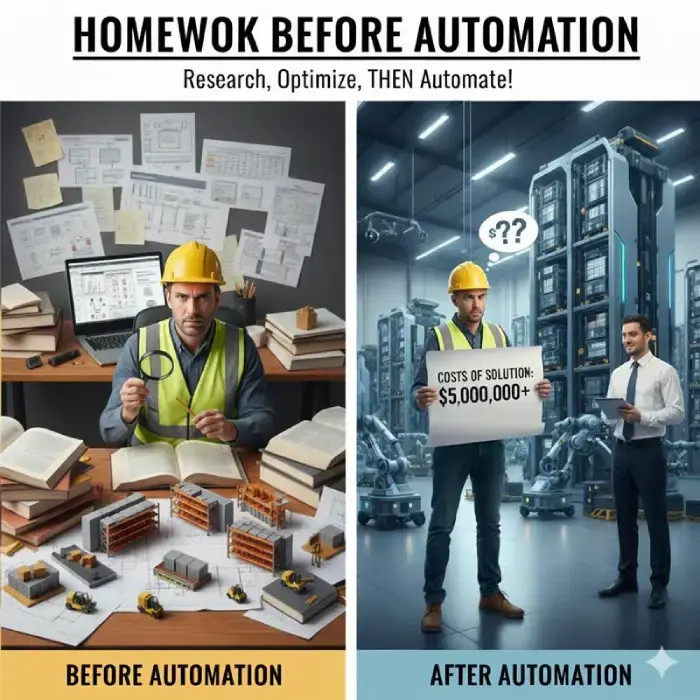
Before jumping into automation, fix what’s broken in your manual operations. It’s tempting to assume automation will solve all inefficiencies, but that’s a costly misconception. Boards and investors will (and should) challenge you on current process efficiency before approving a multi-million automation investment. The business case for automation always looks better when compared to an inefficient manual setup — but that’s exactly the trap. If your calculations are based on poorly optimized processes, your investment will be built on sand. Take the time to streamline workflows, remove bottlenecks, and capture the “low-hanging fruits” first. Clean data and stable processes form the foundation for a solid automation ROI. Badly researched investment assumptions always come back to haunt you — guaranteed. 2. Don’t Rely on Pick Rate Comparisons Alone When comparing manual and automated performance, pick rate isn’t the only metric that matters. In a manual warehouse, putting away a pallet is quick and cheap. But automation changes the equation — you may need to decant products into bins or totes, which introduces additional costs. The right question isn’t just “How fast can I pick?” but “How many order lines do I pick per bin I fill — and what’s the combined cost of filling and picking?” Analyzing this combined metric often reveals that not every SKU belongs in automation. Some item categories might be more cost-effective to handle manually. Making this distinction early prevents oversizing — and overspending. 3. Get the System Sizing Right Sizing your automated system correctly is absolutely critical. Automated storage capacity is expensive. A single automated bin slot can cost several times more than a manual pallet position. That’s why not every piece of inventory needs to live inside your automation zone. You might carry several weeks of supply for your high runners, but that doesn’t mean you should store all of it in the automated system. Smart design — knowing what to store where — can save millions. At WHanalytics, we help clients calculate the optimal stock allocation for automated systems. With the right data-driven sizing model, you can strike the perfect balance between capacity, throughput, and cost efficiency. 4. Strengthen Manual Processes Around the Automation Automation is powerful, but it’s only as strong as the processes that surround it. Manual activities before and after automation — inbound buffering, decanting, order consolidation — can easily become weak links if not planned properly. Establish clear strategies for what, how much, and when to replenish into your automation from your buffers. On the outbound side, consolidating picks from automated and manual zones is often one of the toughest challenges in modern warehouses. Quantify and plan these flows carefully to ensure your automation runs at full potential. Final Thoughts Successful warehouse automation isn’t about buying the flashiest system — it’s about building it on a solid operational foundation. Optimized manual processes, a deep understanding of your material flows, and a data-driven investment case are what separate high-performing automation projects from costly disappointments. Automation should enhance your warehouse, not compensate for inefficiency. Prepare thoroughly, analyze carefully, and let data lead the way — and your automation investment will deliver the returns you expect.
October 28, 2025
blog-1

Why AI Agents Always Will Win Over Traditional ABC Slotting

In today’s fast-moving warehouse world, every meter walked and every second saved counts. One of the most crucial yet often underestimated activities in warehouse management is slotting — deciding where products should be placed on the shelves. Good slotting ensures that fast-moving items are closer to pickers, slow movers are further away, and the overall warehouse flow is as efficient as possible. Poor slotting, on the other hand, increases travel time, creates congestion, and drives up costs. What Is Slotting and Why Does It Matter? Imagine a supermarket where milk is placed in the farthest corner while shoelaces sit right by the entrance. Customers would walk much more than necessary to get everyday essentials. The same logic applies in a warehouse: every unnecessary step taken by a picker translates into lost productivity, higher labor costs & forklift lease, and longer lead times. Slotting aims to solve this. It uses data to determine where each product (SKU) should be stored for the most efficient picking process. Traditionally, this is done through ABC analysis. The Traditional ABC Method – A Quick Overview In traditional warehouse management, ABC slotting is a way to classify products based on their picking frequency or importance: A-items: The most frequently picked SKUs (usually 20% of the items generating 80% of the picks). B-items: Moderately active SKUs. C-items: Rarely picked or slow-moving SKUs. Usually, this classification is done using Excel-based analytics. The analyst takes a dataset — often the number of order lines per SKU in a given time period — and sorts the items into A, B, and C groups. A-items are placed closer to pickers, while C-items are placed further away. It sounds logical, and for decades, this approach has worked well enough. But it has some deep-rooted problems. The Limitations of Traditional ABC Slotting 1. It Depends Heavily on the Person Doing the Analysis In traditional slotting, the quality of the outcome is only as good as the person behind the spreadsheet. Analysts make subjective decisions: Which time period should the analysis cover — 3 months, 6 months, or a year? Which metrics matter most — number of picks? Which locations are considered “good” or “bad”? These choices vary between individuals, which means the results vary too. 2. It Relies on a Single Metric ABC analysis looks at just one dimension — the number of order lines in a fixed timeframe. But warehouse dynamics are far more complex. Seasonality, promotions, new product introductions, and changing order patterns are ignored 3. Feedback Loops Are Weak or Nonexistent Once the new slotting is implemented, measuring actual improvements is difficult. Did the new layout really shorten pick paths? Did it reduce labor hours? Often, the analysis stops at implementation, and the results rely on gut feeling rather than data-backed feedback. In short, traditional ABC slotting is simple but static. It cannot adapt or learn from real warehouse behavior over time. Enter AI Agents – The Next Generation of Slotting Now imagine a system that doesn’t just analyze past data but learns from every pick, forecast, and simulation. That’s what AI slotting agents like Freja Analytics do. AI agents take warehouse slotting to a completely new level by combining data-driven learning with continuous simulation and feedback. Here’s how it works: Trained on Simulated Outcomes Before making any slotting decision, the AI agent runs thousands of simulations to understand the impact of each potential move. It doesn’t just assume — it tests what will work best. Incorporates Feedback from Day One As real pick data comes in, the AI model adjusts its understanding. It learns from every decision, improving continuously rather than relying on one-off human judgment. Uses Multi-Metric Statistical Models Instead of only using one metric (like number of order lines), AI agents consider dozens of factors simultaneously — short, medium, and long-term statistics, forecast data, product correlations, replenishment frequency, and even travel distance patterns. Learns What Makes a “Good Slot” During its learning phase, the agent discovers which item characteristics lead to efficient picking. It learns from both success and failure when waiting times increases, creating a self-improving system that grows smarter over time. Final Thoughts Traditional ABC slotting was once a breakthrough. It gave structure to warehouse organization when data tools were limited. But in a world driven by real-time analytics and machine learning, it has reached its limits. AI agents like Freja Analytics bring a new era of data-driven intelligence to warehouse operations. They combine powerful simulation capabilities, advanced statistical modelling, and real-world feedback to make smarter, faster, and more accurate slotting decisions. The result? Real, measurable savings — often 15–25% shorter pick paths and significant labor cost reductions. In the end, the difference is clear: While traditional ABC depends on static spreadsheets and human judgment, AI agents learn, adapt, and continuously improve. That’s why AI-driven slotting will always win — not by chance, but by data.
October 28, 2025

Mapping of your warehouse into a 3D digital twin

Summary Warehouse picking efficiency depends on how well the facility’s layout is understood and modelled. A digital 3D warehouse map captures aisles, racks, paths, equipment rules, and operational constraints—providing the foundation for AI Agents to calculate efficient pick routes, cluster orders intelligently, and test slotting or layout strategies without disrupting live operations. Why creating a 3D Warehouse Map? Warehouse optimization starts with one principle: you can only improve what you can visualize and measure. The structure of aisles, racks, and shelving directly affects how far workers travel, how quickly orders are fulfilled, and how efficiently goods flow through the facility. Yet many warehouses still rely on outdated blueprints or spreadsheets that can’t represent how the space functions day to day and do not integrate with live data. A 3D digital warehouse map transforms this static understanding into a dynamic, data-rich model of your operation. By capturing the full three-dimensional geometry of the warehouse, this digital replica enables the calculation of travel distances, the modelling of congestion, and the visualization of how workers and equipment interact within the space. Once the 3D model is built, optimization can happen on two complementary levels: Operational optimization: Gain immediate efficiency improvements through intelligent route planning, optimized picker movement, and better order clustering that reduces walking distance and boosts productivity. Strategic optimization: Use the 3D map to pinpoint where operational bottlenecks occur and identify areas with higher safety risks—such as narrow intersections, congestion zones, or high-traffic crossings. This data helps managers redesign layouts, improve flow, and enhance workplace safety before physical changes are made. In addition to these benefits, the 3D map supports simulation and AI agent training. By modelling realistic movement and decision-making scenarios, AI agents can learn how to adapt to changing warehouse conditions—like fluctuating demand, blocked aisles, or shifting storage configurations—and suggest optimized responses automatically. This simulation capability transforms the 3D warehouse map into a capable digital twin — it becomes an interactive environment for continuous learning, testing, and improvement. Key Details Needed for Warehouse Mapping The primary goal of a digital warehouse map is to define how every operational location relates to the others—spatially, functionally, and in terms of travel distance. A complete 3D model should capture both the physical structure and the movement logic within it. 3D Layout and Path Configuration A unified 3D layout and path model gives a complete spatial understanding of how the warehouse operates. It defines not only what exists in the facility but also how everything connects and moves together. A well-built 3D model includes: Physical geometry: The detailed structure of aisles, racks, shelves, and bays, including vertical dimensions. Travel paths: Defined routes between aisles and zones, with intersections, cross-aisles, and alternate paths represented accurately Movement logic: Rules that govern how workers and equipment move - such as one-way aisles, turn restrictions, or safe passing distances. Equipment types can follow different rules in how it can be used in the layout and might have some restrictions in where and how it is operated. By combining layout and movement into one coherent 3D structure, warehouse teams gain a realistic, interactive model of their operations. Optimization tools and AI simulations can use this model to calculate accurate travel distances, detect congestion patterns, and test routing or layout changes before implementing them in the real environment. Connecting the 3D Model to the WMS Linking the 3D warehouse model to the Warehouse Management System (WMS) bridges the gap between the digital environment and real-world operations. Each modelled location - such as racks, bins, or staging zones - should correspond directly to its identifier in the WMS. This connection enables powerful operational insights and visual analytics, including: 3D visualization: See picking stats, zone configurations, filling degrees, weight limits violations in a 3D map. Performance dashboards: Generate heatmaps of travel intensity, dwell times, or zone utilization directly from live WMS data. Bottleneck and congestion analysis: Identify where excessive travel or wait times occur, and test “what-if” scenarios to relieve them. Visual slotting and capacity planning: Combine inventory data with the 3D model to train AI Agents on product placement, picking routes, and zone balancing more intelligently. When geometry and operational data are synchronized, the 3D warehouse map becomes an intelligent control layer - transforming static information into actionable visualization and simulation environments. Final Thoughts While many Warehouse Management Systems offer rule-based optimization or batching logic, true optimization requires a 3D understanding of your facility. With a detailed 3D map, you can: Optimize routes and order clusters in real time. Simulate layout changes before they’re implemented. Train AI agents to support daily optimization and adapt to dynamic conditions. Identify and address bottlenecks and safety risks proactively. The result is a warehouse that continuously learns, adjusts, and improves—achieving meaningful, measurable gains in efficiency, accuracy, and safety.
No results found.